Weekly Update - April 18, 2025
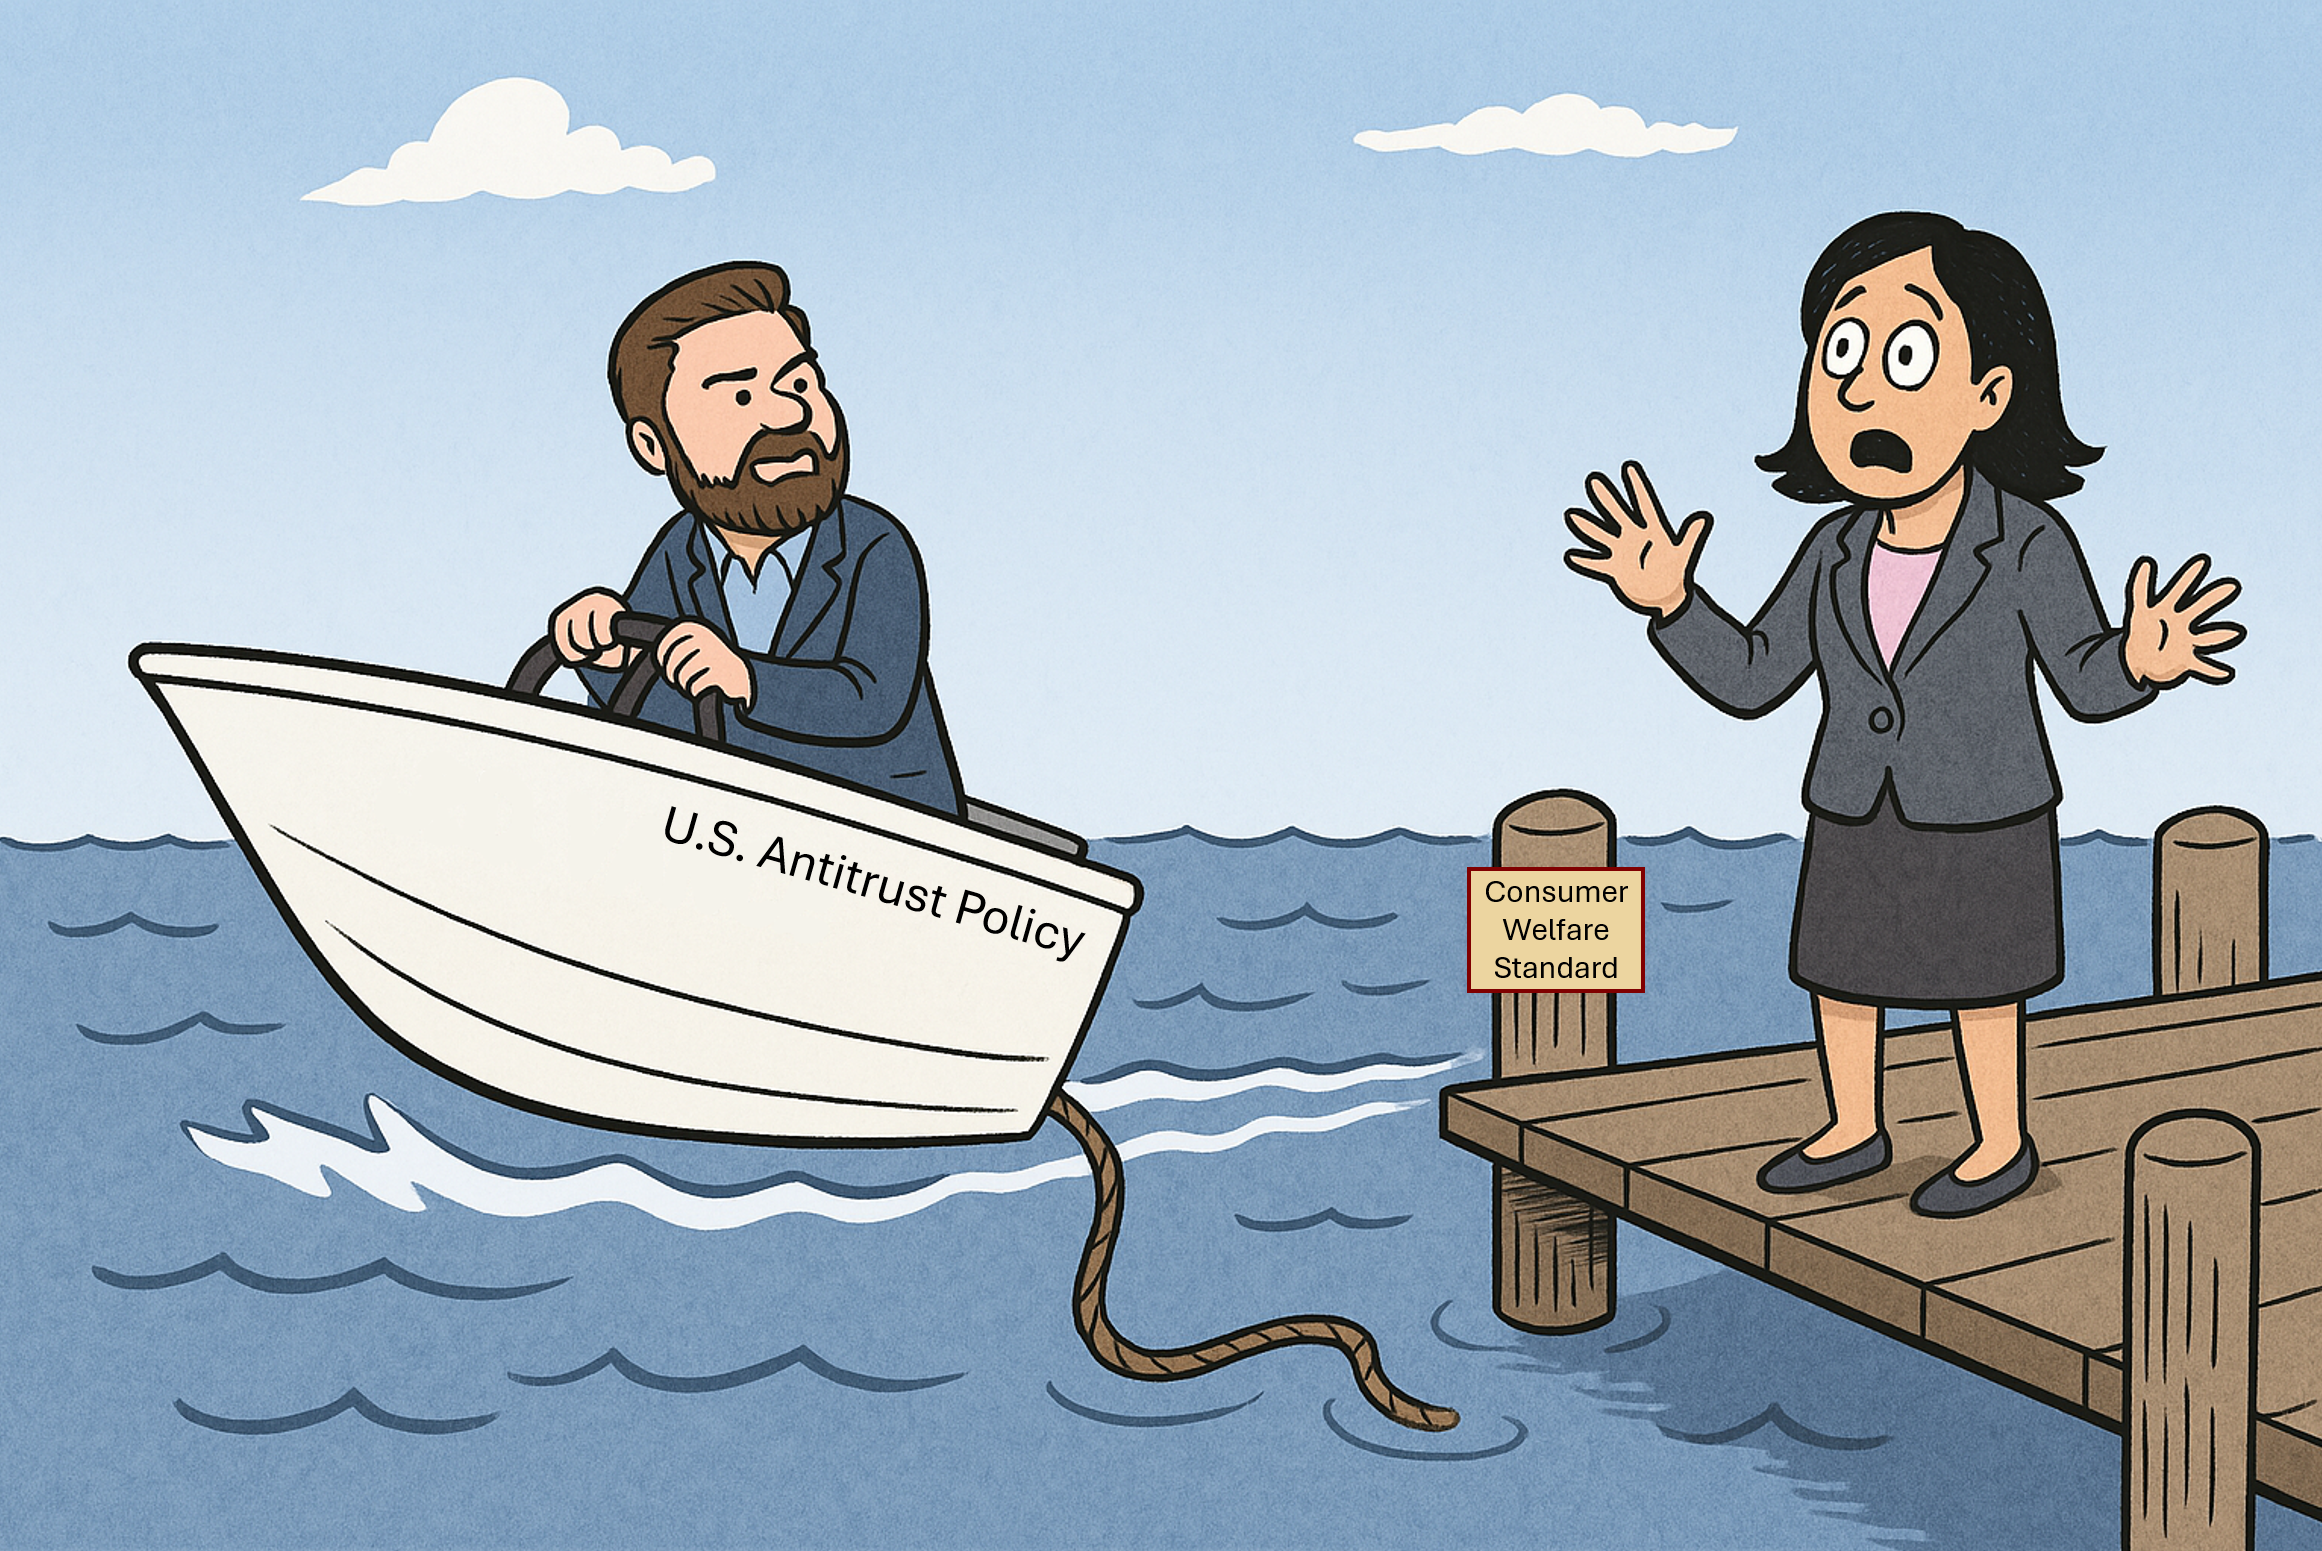
An illustration for this Axios article. Lina Khan has unmoored antitrust enforcement from the consumer welfare standard, and now J.D. Vance is using it for his ends, to the dismay of the neo-Brandeisians.
Last Week's Posts
 |
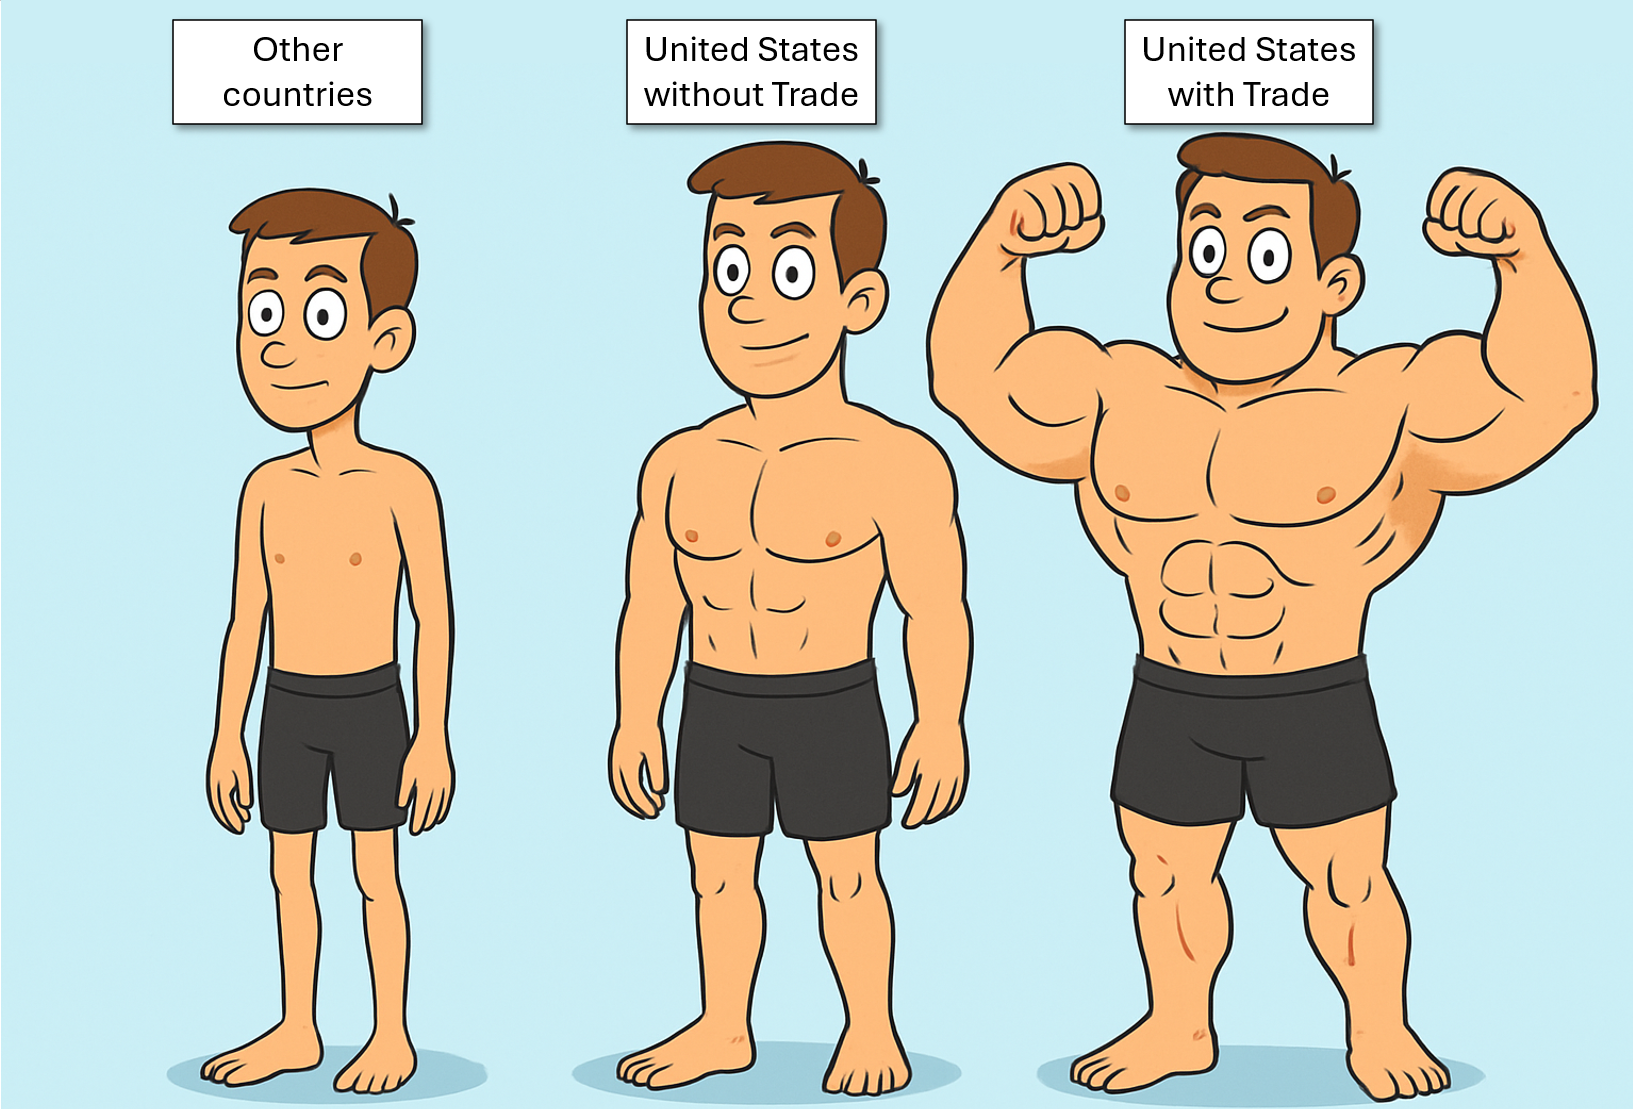
Oren Cass's Case for Trade A good faith and objective consideration of the approach Trump's trade team used to set tariff rates |
 |
How I'd Argue Meta v FTC A cursory reaction to the arguments in the FTC trial against Meta and how I'd approach the case |
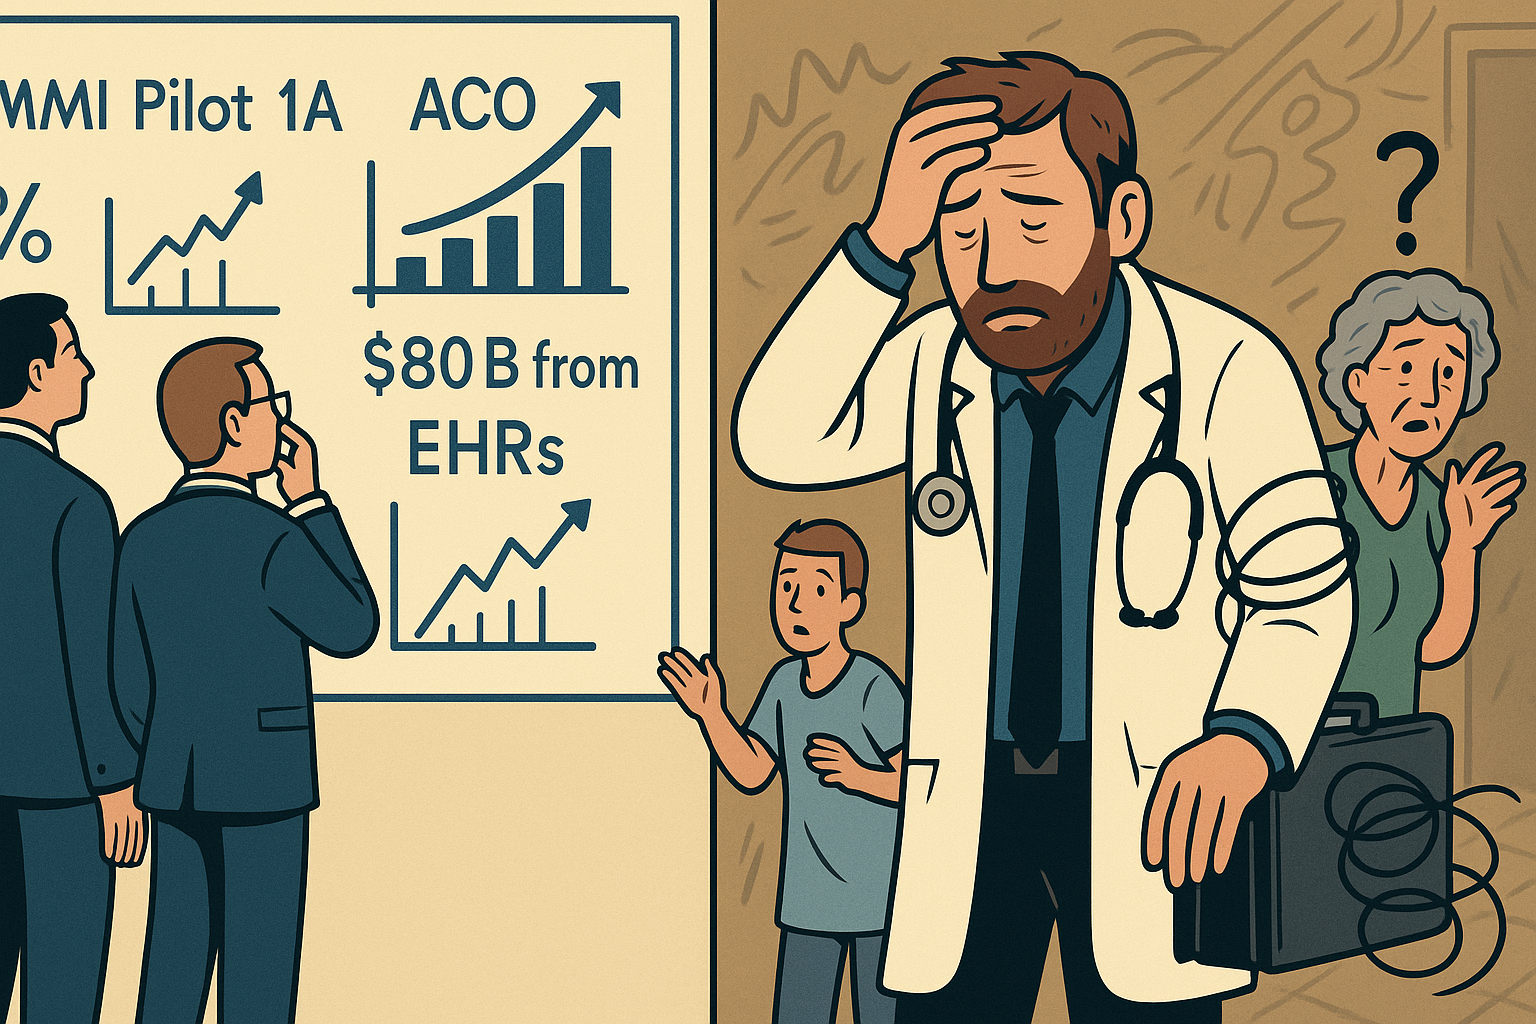 |
ACA Failures and the Limits of Technocracy A summary of three overlooked, but major failures of the ACA and how they show the difficulty of regulating a complex industry |
 |
The Other Lesson of I, Pencil |
Quotation of the Day - May 26 2025 |
Popular Posts

Tariff Calculus
An explanation of how Trump's team determined the tariff rates and what they got wrong
Trump's Tariffs and the Major Questions Doctrine
An argument that the Supreme Court's Recent Major Questions Doctrine opens the door for a legal challenge to his tariffs

Hopeless?
The ACA Supreme Court Case highlighted fundamental disagreements between parties and ideologies that may not be reconcilable.
Other Interesting Reads
What Happened To Never-Needed Regulations
Ryan Young CEI
The Census Defines the Poverty Rate Up
Phil Gramm; John Early WSJ
Another Wrong Way to Measure Poverty
Phil Gramm; John Early WSJ
The 3 Myths Supporting NIH Funding
Zachary R. Caverley Reason
Thanks to De Minimis Exemption, Forever 21 Won't Be Last Bankruptcy
Wilmer Leon RealClearMarkets
Reconciling the Official Poverty Measure and CBO’s Distributional Analysis of Household Income
CBO CBO
A Win-Win Proposal to Fix Social Security
Tyler Watts EconLog
Argentina's DOGE
Alex Tabarrok Marginal Revolution
Don't let the next crisis grow the government—again
Clyde Wayne Crews CEI
Reflection after Five Papers about Climate Change
David Barker Econ Journal Watch
How Liberty Upsets Patterns
David Henderson EconLib
Why We Cannot Have Nice Things
Scott Sumner EconLib
Eisenhower Warned Us About the Scientific Elite
Zach Weissmueller Reason
Computational Analysis of US Congressional Speeches Reveals A Shift from Evidence to Intuition
Various Nature
Regulatory quality is declining
James Broughel Mercatus Center
How do you ask good questions
Tyler Cowen Marginal Revolution
High US health care spending is quite well explained by its high material standard of living
Unknown Random Critical Analysis
New Montana Law Blocks the State From Buying Private Data To Skirt the Fourth Amendment
Joe Lancaster Reason
Selected X Posts
From Others
This is a poor joke, but my son and I have challenged each other to write original knock knock jokes.
— David Marcus (@BlueBoxDave) April 11, 2025
His was masterpiece was:
Knock knock
Who’s there?
Kamala Harris
Kamala Harris who?
I’m sorry, I’m not taking questions at this time.
It’s really good. https://t.co/98Ukm7oDxf
— Sal the Agorist (@SallyMayweather) April 4, 2025