Blog
Friday, January 3, 2025
Administrative Costs Aren't Waste
The murder of Brian Thompson has rejuvenated debate on the American health care industry, which had been a relatively sleepy topic since the failed attempt to repeal the ACA in 2017. Prior to the passage of the ACA in 2010, the American health care industry was decried as high cost, inefficient, and poor quality. Documentarian Michael Moore released Sicko in 2007 documenting all the problems with American healthcare: our life expectancy was comparatively low even though we spent more money than any other advanced nation in the world; health insurance companies caring only for profit, would deny legitimate claims; hospitals and physicians charged too much; there was too much emergency care which was higher cost; the system treated symptoms not causes; health insurance was too expensive and people with pre-existing conditions couldn’t purchase it at all; and 45 million people were uninsured.
While the ACA did nothing for most of those problems, the debate about healthcare practically disappeared after its passage. There were individual issues here and there—surprise billing, individual mandate, public option—but the topic never became a major national issue the way it was from 2004-2010 until last month.
Time will tell if this persists, especially once President Trump takes office and begins working on his agenda which will focus more on immigration, taxes, and regulations, but the recent uptick has resurfaced some of the same arguments from 15 years ago.
The Debate So Far
Noah Smith, an economist and writer, argued that the criticism of insurance companies is misplaced. Smith’s core argument is that because insurance companies are not very profitable, they cannot reasonably be thought of as the source of the large problems in healthcare. Essentially, the anti-insurance company bastion are arguing that insurance companies are collecting premiums and then doing everything they can to not pay for their beneficiaries’ care, and pocketing the difference, but if their profits are low, then the degree to which they could be squeezing those in need, must also be low.
In response, Matt Bruenig argued the opposite, that health insurers are the worst aspect of America’s health care system, and bear a disproportionate share of the blame for the problems. The crux of his argument is that 16% of money spent on health insurance goes to administrative costs. On top of that, another 19% of hospital revenue goes to administrative costs. He concludes, then that for every $100 spent on health insurance, only $68.04 actually goes to health care.
Firstly, he omits some important elements, out-of-pocket costs bypass insurance altogether and go to the hospital. Hospitals aren’t the only entities that insurance companies pay. Physicians and clinics both have lower administrative costs according to the CBO analysis he cites. The CBO report he references also doesn’t seem to include administrative costs outside of CMS, such as the Centers for Medicare and Medicaid Innovation or MedPAC; both of which represent government spending to support Medicare. Further, Avik Roy points out how Medicare administrative costs can be misleading.
Administrative Costs Can Help Reduce Overall Costs
Bruenig’s core argument is that these administrative costs are completely wasteful, but that’s not entirely true. Firstly, there’s profits. Profits are incentives for both sides to reduce costs. And these are low for insurance companies, below 5%, lower than other insurance products and most other industries. Hospitals’ profit margins are even lower.
Insurance companies reduce costs in many ways beyond the most infamous. They research the value of new and existing procedures; they use network design to nudge beneficiaries to the most efficient hospitals; and they find design their cost structures to incentivize better-value care. There’s no better example of what the benefits of administrative costs can achieve than the example Bruenig believes supports his argument—Medicare Advantage. While we tend to think of Medicare as a fully government-run and administered insurance product, it is actually divided roughly equally between the traditional Fee for Service Medicare (FFS) that everyone basically understands, and Medicare Advantage (MA), which allows seniors to choose a private plan that offers all the services of traditional Medicare with extra benefits.
Medicare Advantage Deflates Bruenig's Argument
Bruenig points to sources that claim that Medicare Advantage plans have much higher administrative costs, 17% versus 1.3% for FFS. Though the numbers he uses aren’t entirely accurate1 or instructive, what Bruenig and most others don’t realize is that Medicare Advantage plans provide the same services to seniors that traditional Medicare provides, but at a lower cost. So, whether in spite of the higher administrative costs or because of them, the private payers achieve lower overall costs than the public payer.
Medicare Advantage plans are private insurance plans paid based on many factors, interacting in complicated ways. What’s important to know is that every year these plans estimate the cost of covering their beneficiaries. This estimate is submitted to the government as a “bid.” The government compares this bid to what it pays to cover similar seniors2 and pays the plan their bid plus some of the difference between the plan’s bid and what Medicare expected to pay for that beneficiary.
MedPAC reports that, on average, Medicare Advantage plans’ bids are 79% of traditional Medicare’s costs, suggesting that the private plans can provide the same services as Medicare inclusive of administrative costs, for 21% less than Medicare.
To be sure, there are many countervailing facts that muddy this comparison. Many people believe that MA plans manipulate the system by attracting healthier people within the risk groups and then “up-coding” them into a less-healthy risk group to boost their payments. However, even after these elements are factored in, MedPAC concludes that the bids are about the same as Medicare’s actual costs, meaning that even accounting for favorable selection, up-coding, administrative costs, and profits, MA plans cost about the same as traditional Medicare, and there is reason to believe that their estimate of up-coding is excessive.3
Lastly, the bids are inclusive of administrative costs and profits so are above what the plans actually spend on direct healthcare for their beneficiaries. Bruenig uses the Medical Loss Ratio (MLR), to determine what actual costs are, which seems appropriate. He points to a KFF analysis that found that 83% of MA plans’ revenues goes to actual healthcare1, which would imply that the administrative costs are allowing these private plans to find a way to provide the same healthcare services to seniors for 17% less than traditional Medicare.
Private plans provide the same services to Medicare beneficiaries at lower cost than traditional, government-run Medicare
When all of this information is taken together, it shows that Bruenig is incorrect to say that the administrative costs in health insurance represent an enormous, wasteful drain on resources, and the Medicare Advantage program, contrary to his assertion, undercuts his argument. Given MedPAC’s analysis, one could conclude that administrative costs do serve to lower health care costs, but perhaps not by more than the administrative costs add to it. As with most topics, it’s a complex issue with many interacting and constantly changing components that defies simple analysis.
Footnotes
1In reality, the MLRs for MA plans are higher than 83%. By law, they must be 85% without incurring penalties. 83% was specific to 2020, which was an uncharacteristic year due to Covid. Most years KFF found MA MLRs fell between 85 and 87%. Also, KFF’s analysis leaves out money that plans spend on health benefits that beneficiaries receive. Including them as administrative costs is inappropriate.
2Medicare risk adjusts payments to account for differences in age, sex, previous diagnoses, and geography.
3To estimate up-coding in 2024, they took their 2021 estimate, and extrapolated a 2024 estimate based on the 2017-2021 trend, which was higher than other years. While it wasn’t necessarily wrong, it’s an estimate based on three-year old, atypical experience in an extremely dynamic environment.
Wednesday, September 25, 2024
The ACA Achieved None of Its Goals
It's been more than ten years since the ACA was fully implemented, and by most measures it has failed. In the 2008 election and the later part of 2009, healthcare reform was a top issue. For much of the campaign, before the financial crisis hit in mid to late 2008, it was the top issue. Candidates Obama and Clinton sparred frequently on the topic. The documentary film Sicko, Michael Moore's follow-up to his enormously popular Bowling for Columbine, and not quite as popular Fahrenheit 9/11 investigated the health care industry from many angles and served as a foundation for much of the criticism of the industry and urgency for reform.
The goals of healthcare reform were numerous. The overarching goal was to reduce the number of uninsured in the U.S. Almost as important was to reduce costs and improve outcomes. Few people have looked back at the full slate of goals of the ACA or the projections that accompanied it. Mostly, policy wonks focus on the one goal for which it was relatively effective and ignore the rest. Looking at all of the dimensions, though, and how they progressed over the past fifteen years shows that the ACA didn't solve almost any of the problems that were the biggest discussion points before the legislation even existed, and it often didn't meet the expectations set for it after it was written.
Uninsured
The primary goal of the ACA was to reduce the number of Americans who didn't have insurance. In the run-up to the legislative effort, the number of uninsured was ubiquitous in the news. While that goal was based on numbers that were greatly misrepresented (70% of the new Medicaid enrollees were eligible prior to ACA and chose not to sign up, and another large subset were illegal immigrants), even the expected reduction was never achieved.
CBO estimated that, by 2019, the number of uninsured would fall by 31 million. In reality, it fell by less than 15 million, before accounting for population growth and the booming 2019 economy. The Urban institute estimated a reduction of around 28 million.
Behind the numbers, Medicaid was expected to grow by 16 million, but it actually added 20 million more beneficiaries. The exchanges were projected to insure an additional 23 million Americans. By 2019, only 11 million people enrolled in an exchange plan.
The largest miss, and the biggest failure of the ACA is that it completely decimated the existing non-group insurance option. Before the ACA, there were approximately 15-17 million enrolled in private plans. By 2019, the combined enrollment in ACA and non-ACA plans was just under 19 million, meaning that the exchanges and subsidies did not generate much net improvement in the insurance rate because most of the ACA gains came out of or at the expense of the existing private plans.
Premiums
It's a universally acknowledged miss that President Obama promised that the ACA would "bend the cost curve down." He specifically said that the ACA would lower premiums for families by $2500/year on multiple occasions.
In 2017, Forbes published an article already calling into question this result.
Using National Health Expenditure Data provided by CMS, one can verify that the Forbes article was correct. Increases in private per enrollee costs grew faster after the implementation of the ACA. Costs for "Other Direct Purchase" which includes off-exchange plans, rose 5.4% per year from 2001 to 2013, and 8.6% per year from 2013 to 2022, after the ACA was implemented. Marketplace plans, specifically, have increased, on average 5.3% per year.
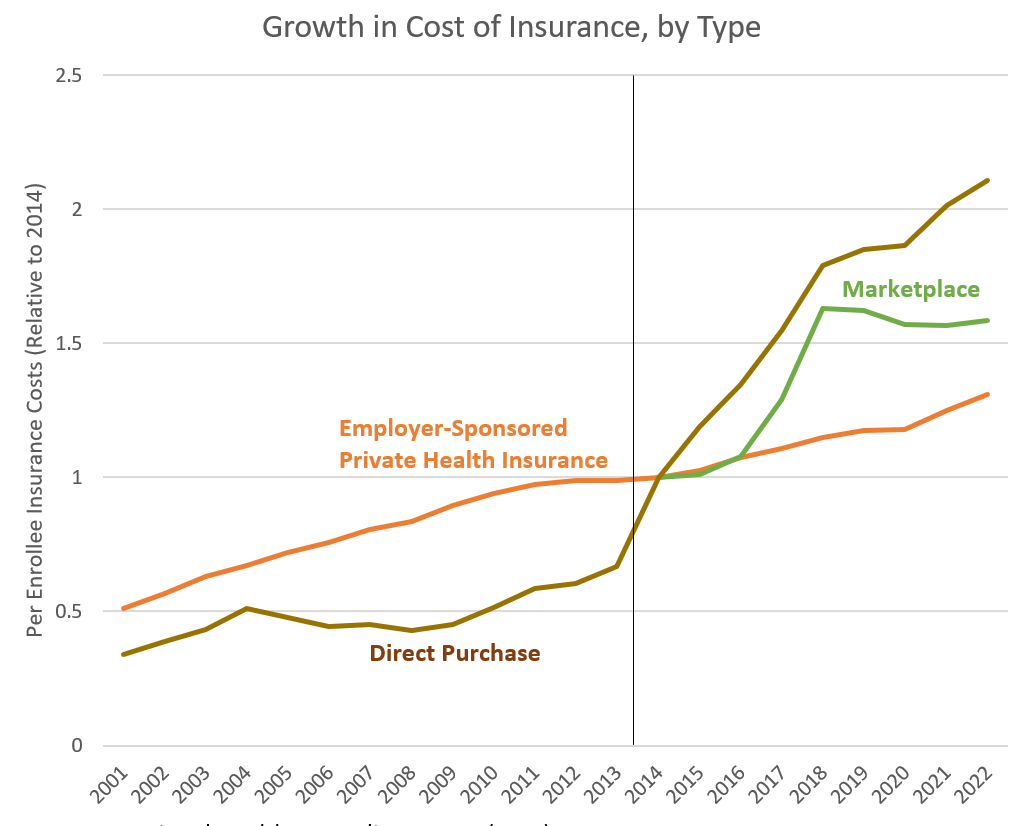
While the ACA was supposed to make insurance more affordable, the costs of insurance rose faster after its implementation compared to before. Everyone doesn't incur those costs equally, however. People who are insured through Marketplace plans may be eligible for some level of subsidy, depending on their income, which reduces the costs to them of the increased premiums. Those millions who are not eligible are now much worse off than they were before the ACA.
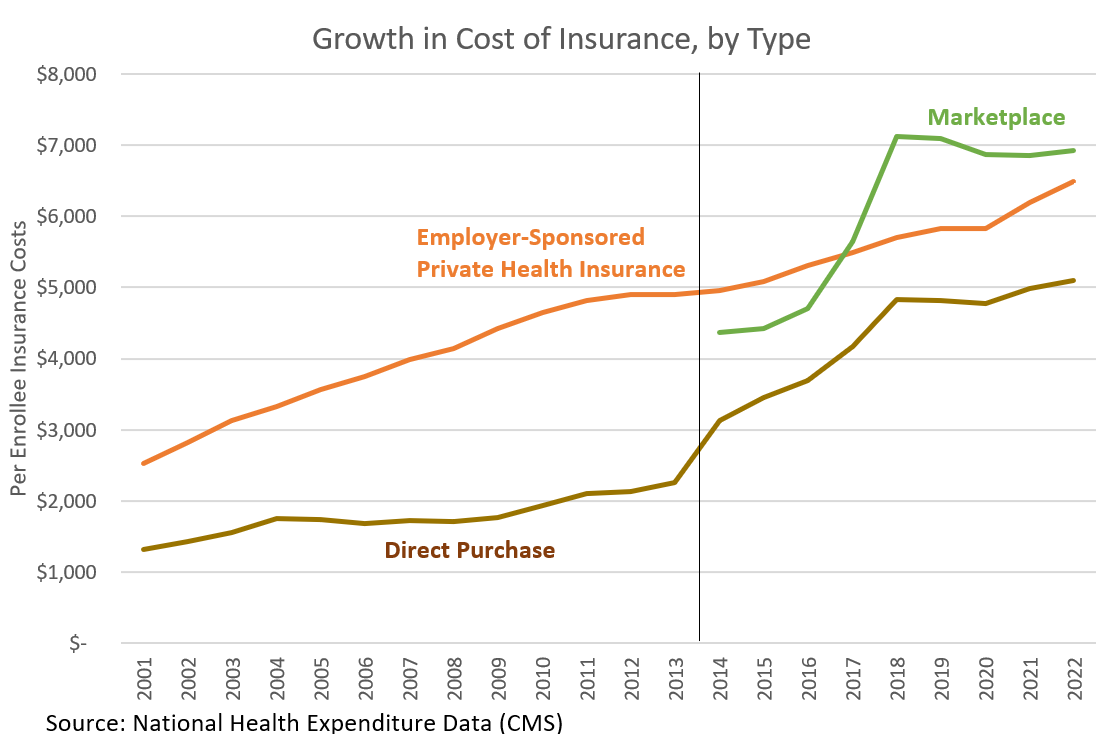
Costs for Exchange Plans are higher than the private, non-exchange plans
Note also that studies were done in 2013 projecting, due to experience up to then, that premiums would save even more money. Few studies have been done since, but every indication is that this was just a temporary phenomenon.
Outcomes
The most widely discussed health outcome prior to the ACA was US life expectancy. The fact that Cuba had a higher life expectancy than the US was frequently used to claim that the Cuban health care system was superior to the US's. Remarkably, since the passage and implementation of the ACA, life expectancy has improved at a much slower rate than before passage.
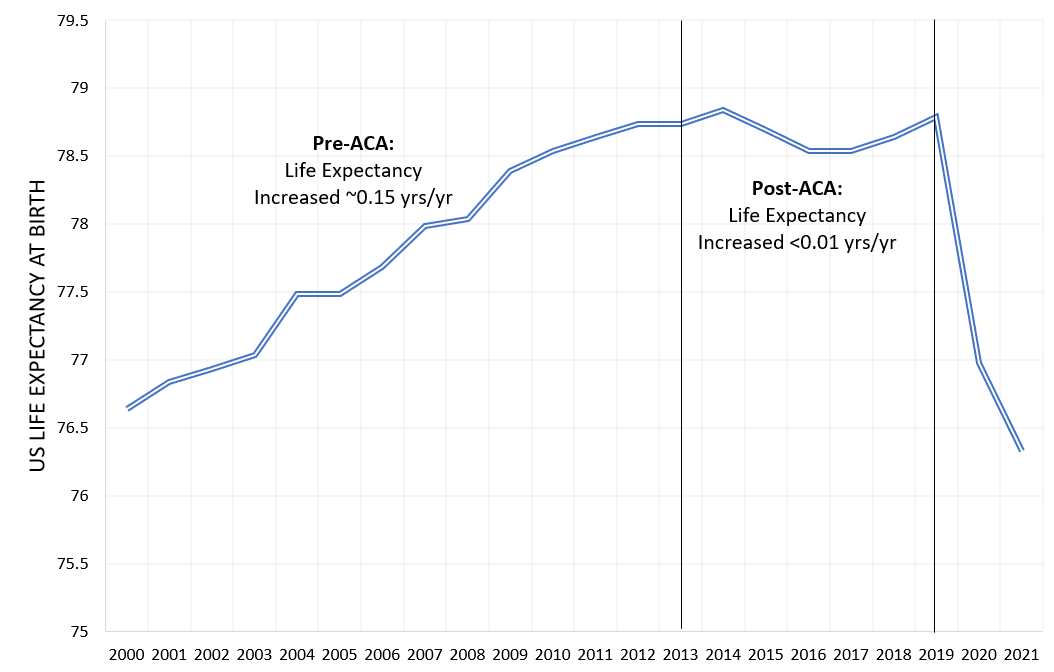
src: Data Commons
In addition to life expectancy, a primary goal of healthcare reform was to reorient care towards prevention and reduce emergency visits. According to CDC, the ED visit rate was unchanged between 2009 and 2019.
Conclusion
A careful review of the main healthcare challenges that were being discussed in the run-up to 2010, the problems politicians and media said would be solved shows that for every one of them, the ACA failed to solve the problem. In one case--the insurance rate--it helped, but in every other dimension--affordability, outcomes, appropriate coverage--it failed. Maintaining a rich skepticism of government's proposed solutions and their expectations cannot be emphasized enough.
Assorted Links
Obama's Broken Promises Blase - ACA and Trump RetrospectiveObama Healthcare Speech June 2009
Obama Healthcare Speech Sep 2009
Ben Bernanke Healthcare Speech 2008
Vance's statement about pre-existing conditions
New York Magazine - Vance wants to destroy healthcare
Side Comment on Using AI Resources
I'm not optimistic about ChatGPT or its competitors. There's clearly an existing internet bias towards the left, because the left produces more content. Try a google news search on a topic where you know there's a good right-leaning argument. You probably won't find it.
— Chris Oldman (@ChrisOldman4) September 27, 2024
As a side note, multiple AI chatbots said that the ACA did better at providing insurance, but wouldn't give me any source.
In addition, multiple said premiums have risen more slowly after ACA. One pointed me to this study done in 2013, before full implementation, and based on a weird metric, this study that reports individual year results, not the trend after ACA or before.
Tuesday, March 7, 2023
Did ACA Produce Free Healthcare?
An interesting observation was bouncing around Twitter over the weekend.
Fabulous point... in 2010 when Obamacare passed, health care was 17% of GDP and uninsured rate was 16%
— Timothy McBride (@mcbridetd) March 5, 2023
Today? health care 17% of GDP and uninsured rate is lowest ever: 8%!
See: https://t.co/athQpfpkww https://t.co/Q0SD1ObscA https://t.co/h8qMMiWVyg pic.twitter.com/CrEscJ8C4P
Left-leaning opiners are quick to attribute the success to the ACA, but it's not at all clear from the graph that this is what's happening.

Going back to 1990, the trend seems to be a sharp increase during recessions and then a gentle decline during expansions. This is true for 25 years up to 2015, when there's a slight bump up. Then, it begins another gentle decrease until the pandemic when it goes crazy. This graph certainly doesn't show that the ACA reduced health care costs.
But it's still an interesting observation that coverage is higher than it was despite the overall costs falling to pre-ACA levels. Despite the attempted attribution to the last major Democratic accomplishment, the cause is very difficult to pin down. The pandemic caused once-in-a-lifetime shocks to both healthcare and the economy. On the latter, there was a sharp decrease in GDP early-on, followed by an enormous stimulus that resulted in a quick economic recovery and then went on to cause a boom in demand that raised prices.
In healthcare, there was an immediate increase in demand for those who contracted Covid, but otherwise a sharp drop in healthcare demand as hospitals were not allowed to see non-Covid patients. Furthermore, policy changes in Medicaid and subsidies for the ACA upended the traditional coverage breakdown and also high employment would generally mean higher coverage through Americans' workplaces.
Two potential causes are services like telehealth, which is a lower-cost health care service, but this seems too small to account for a 2% of GDP drop in healthcare costs. A more likely cause is a shift from commercial to Medicaid. Medicaid reimbursements are infamously lower than commercial, so if more people switch from commercial insurance to Medicaid, high coverage rates would be achieved at lower cost.
The downside of this would be that providers would lose enormous sums of revenue. This can be tested by digging into the National Health Expenditures data.
The other potential cause is that healthcare coverage doesn't really mean anything. It's important to remember that having insurance does not necessarily equate to using healthcare services. Unless you have a chronic condition, visiting a doctor is a sporadic event. From 2001 to 2011 (for some reason the Obama Administration decided to stop producing these reports), the Census put out information on healthcare utilization. In 2011, the last available, 26% of people did not visit a medical provider at all; only 8% spent a night in the hospital; 57% did not take any prescription drugs.
Perhaps coverage increased, but it did not produce an increase in utilization. In fact, this theory is supported by the other graph in the Tweet.

Most of the drop in uninsured occurred in 2013. This marked the year both when subsidies kicked in for the healthcare exchanges and also when Medicaid expansion kicked in for the states that expanded.
But was there a simultaneous increase in healthcare costs? Looking back at the healthcare cost graph for 2013-2014, if anything, it shows a slight decline. This suggests that the explanation for the coverage/cost conundrum is that they are not strongly-linked. Particularly for Americans who are currently uninsured. It is a criminally under-reported fact that many who are not insured choose not to be despite having access to free or subsidized coverage.
Lastly, this entire observation may be ephemeral. The original graph of costs is not from CMS or a government agency, and thus is not the official value, but a non-profit organization's attempt to recreate it on a monthly basis. Their numbers are not quite the same as CMS for the years where they overlap, and notice that the graph goes into 2022, data unavailable through CMS. This wouldn't be the first time that pundits were quick to react to partial information that proved their point and then were proven wrong.
Thursday, March 2, 2023
Wasting Billions of Taxpayer Dollars - ACA Subsidies Edition
One of the reasons we have to go through a debt debate when we Republicans control Congress and Democrats control the Presidency, is because of how much money the government wastes in pursuit of its aims.
By waste, I do not mean only requirements piled on to subsidies, such as in the CHIPS Act, that diminish the effectiveness of the money funneled to them. I mean the government could spend less money and achieve the same result.
The Inflation Reduction Act's environmental provisions constituted a similar level of government waste in that the amount of money dedicated to reducing carbon emissions went beyond even the Biden EPA's astronomically high estimates of carbon emissions' costs.
According to several recent studies, Health and Human Services is getting in on the public funds bonfire by channeling large sums of money to insurance companies in the guise of "enhanced" subsidies to ACA Marketplace enrollees. If like most policy wonks, you measure the success of a policy by how many more people are insured, then the enhanced subsidies are an extravagantly bad avenue to pursue.
Two studies1 both found that poorly designed websites or portals imposed a hurdle for potential recipients significant enough to prevent many, particularly the young, poor, and healthy, from signing up for coverage. That automatically selecting a plan for would-be recipients is equivalent, in terms of increasing insurance coverage to lowering the premium by hundreds of dollars.
The American Rescue Plan Act and then the Inflation Reduction Act accomplished this feat by spending $25 billion per year (estimated) to subsidize coverage for people making up to more than $100,000/year. The same gains in coverage could be achieved much more cheaply through better program design.
Wednesday, February 8, 2023
Does Access to Medicaid Improve Health?
There have been several studies and politicians over the years purporting that health insurance, in general, and specifically Medicaid saves lives. A recent working study has found that, contrary to previous research, Medicaid expansions do not save lives. This result calls into question the numerous promises that were made in the ACA debate and foundations for a single-payer health system.
- Add Bernie Sanders claims about lives saved
- Medicaid promises during ACA debate
The canonical study on Medicaid was published in the New England Journal of Medicine in 2012. It found that Medicaid expansion led to a statistically significant reduction in "adjusted all cause" mortality. While the research was conducted after the passage of the Affordable Care Act, it was still before the implementation of Medicaid expansion, and consequently focused on pre-ACA expansions of Medicaid.
The small number of expansions is one of the primary reasons that the current study finds different results. The 2012 study was based on only three states, and furthermore, only found an effect in one of those states--New York. Drawing a conclusion for the entirety of the country based on the experience of only a single state, which is obviously not representative of the other 49 states in many ways, leaves ample space for over-interpretation of results.
Of course, the famous paper on the Oregon experiment in Medicaid expansion that found no effect is cited, yet appropriately caveated. The experiment wasn't large enough to detect small improvements and it was pretty soon after expansion, before there was enough time for improvement to occur.
Then there are two more recent studies on the ACA that found improvements in mortality of 3.6% for everyone and 9.4% for 55 to 64 year olds.
The authors of the new study focused on 8 of the 16 states that expanded Medicaid prior to implementation of the ACA. In true Brandeisian fashion, each state implemented its own version of Medicaid expansion--differing in the range of incomes affected, the years of implementation, the requirements, etc., offering researchers a panoply of variation from which to discern an effect.
They found that contrary to the other studies, those based on ACA and the one based on the three states only, that Medicaid did not reduce healthcare-amenable mortality, i.e. mortality that can be improved through better or more healthcare. This would include treating heart attacks or communicable diseases but exclude catastrophic car crashes and drownings, for example.
In fact, in none of the eight states that expanded Medicaid, was there an improvement in mortality that was determinatively produced by the expansion and wasn't just statistical chance. Reinforcing that result, without accounting for statistical variation, only three of the eight states even showed a reduction in mortality; the other five states had higher mortality rates after expansion.
To demonstrate that this study was an improvement on the previous three-state study, the authors even used their data and approach in an attempt to replicate the methods and results of its predecessor, and they succeeded. They found, just like the three-state study, that New York did show an improvement, and it was larger than the others. This provides support that the previous study was lacking in sample depth and rigor which led to a faulty conclusion.
Finally, the authors address the ACA studies and conclude that it is likely that the mortality effects are more significant for older populations but also that the other results may be partly driven by the non-expansion aspects of the ACA such as woodwork effects from the marketing campaign which would mean that mortality improvements could be achieved without expansion.
How Much has Zero Improvement Cost Us?
In 2013, the year of implementation of the ACA, approximately 18.7% of Americans were enrolled in Medicaid. In 2020, before Covid and its resultant legislation caused an increase in enrollment, that figure was 22.4%. So a cursory estimate is that the ACA led an additional 3.7% of Americans to enroll in Medicaid.
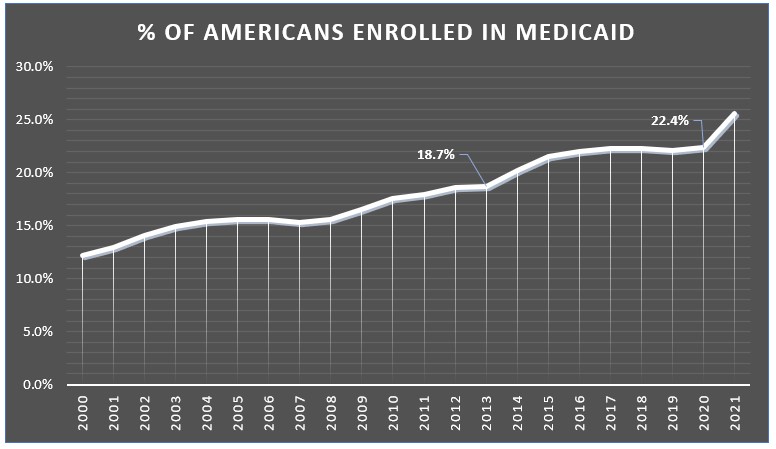
Multiplying that by costs per enrollee and the total population, the cost in 2020 for expanding Medicaid was $112 billion. Applying that same approach to every year from 2014 to 2021, a combined $700 billion has been spent without achieving any mortality benefits.
From 2014 to 2021, a combined $700 billion has been spent without achieving any mortality benefits.
Even if we assume a 10% improvement in mortality, higher than either of the studies that found an effect, this works out to saving 560 lives per year and spending $200 million per life saved1, 20 times the value used by the EPA in their recently proposed social cost of carbon update.
Had a 10% improvement in mortality been achieved, Medicaid expansion would have spent $200 million per life saved, substantially more than policy-makers deemed effective.