Blog
Monday, March 24, 2025
Cutting Medicaid is Possible
In February, Republicans announced their intention to cut $2 trillion in spending over the next 10 years. $880 billion of that is to come from the Committee on Energy and Commerce (See Title II), which oversees Medicare, Medicaid, national energy policy, environmental protection, and several others.
Just doing basic searches on Medicaid cuts, trying to find information, all of the top stories include a warning about how many people are going to be hurt by this, but interestingly, there are no mentions of how much Medicaid has grown in the past ten years, even beyond its ACA expansion, how fast it's projected to grow, or how much waste could be cut. Every story just assumes, without including details, that every penny of Medicaid goes to children, poor adults, or disabled adults, but given the recent expansions, this seems unlikely.

The Recent Run-Up in Medicaid
Since 2000, federal Medicaid spending has been trending upward. In 2000, after 8 years of a Democratic president, federal Medicaid spending was just 1.1% of GDP, and it has nearly doubled since then. Some of that surely is the increasing cost of medical care, but it's also driven by enrollment growth due to expanded eligibility and state incentives to get matching federal funding.
Federal Medicaid Spending as a % of GDP
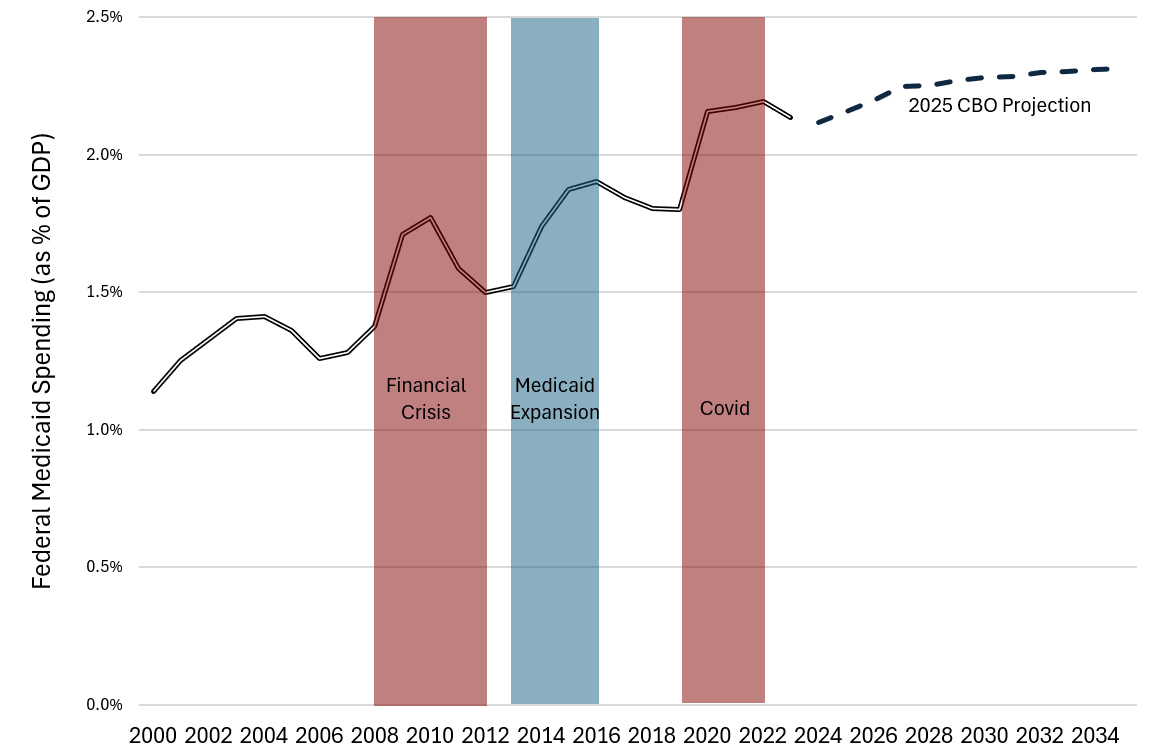
Source: Author Calculation based on NHE (Actual Federal Medicaid Expenditures), FRED (Actual GDP), CBO (Projected Medicaid and GDP)
In the last twenty-five years, the largest, single-year increase in federal Medicaid spending occurred in 2020, the year of Covid. This, in and of itself, is unsurprising, but what's harder to understand is why it has barely fallen back to its pre-Covid rate, even four years later, while the economy has boomed.
In the last twenty-five years, the largest, single-year increase in federal Medicaid spending occurred in 2020, the year of Covid. This, in and of itself, is unsurprising, but what's harder to understand is why it has barely fallen back to its pre-Covid rate, even four years later, while the economy has boomed.
Waste, Fraud, and Abuse
CMS periodically estimates the total "improper payments" in Medicare and Medicaid. The most recent estimate for Medicaid is that 5.1% of total Medicaid payments are "improper." While that sounds like fraud, in fact, the majority of these improper payments are simply insufficiently documented legitimate payments. They also estimated how much of the improper payments were actually illegitimate and found that 20% of them are truly improper and should not have been paid out.
Applying this rate of illegitimate payments to the CBO's ten-year forecast produces an estimate of $91.2 billion over ten years that can be saved without harming Medicaid recipients.
Applying this rate of illegitimate payments to the CBO's ten-year forecast produces an estimate of $91.2 billion over ten years that can be saved without harming Medicaid recipients.
Locking in Normal Growth
One approach Republicans might consider would be to lock in overall Medicaid growth to match its 2016-2019 rate. This was a time of a stable economy, after the major ACA expansion and before further expansions under Covid-era policies and the Biden administration. It represents a steady-state era for Medicaid.
During this time, Medicaid grew at 3.1% per year. This would represent smaller growth than the CBO estimated (between 4 and 5% per year).
Federal Medicaid Spending Growth by Year 2000-2024

Source: Author Calculation based on NHE (Actual Federal Medicaid Expenditures), CBO (Projected Medicaid)
Holding growth in Medicaid to the 2016-2019 average over the next ten years would save $778 billion. Considering that 2016-2019 was a time without major cuts to Medicaid benefits or eligibility, it would seem possible to lock in that growth rate without harming any beneficiaries.
Federal Medicaid Spending if Growth Held to 2016-2019 Rate

Source: Author Calculation based on NHE (Federal Medicaid Expenditures), CBO (Projected Medicaid)
Locking in Enrollment Levels
Another path Republicans might take is setting an enrollment target for Medicaid, which is supposed to assist the poorest Americans, yet enrolls close to 1 in 4. According to poverty statistics, before accounting for transfers 11.1% of Americans are impoverished. Medicaid, however, covered 27.4% of the US population in 2023.1
From 2000 to 2023, enrollment in Medicaid has grown from 12% of the population to 27% of the population, more than doubling, even though the federal poverty rate has barely moved, going from 11.3 to 12.5%. Some of that, obviously, was intentional, as the ACA expanded Medicaid, but in 2019, before the pandemic hit, and after state expansions had taken place, Medicaid penetration was only 23.0%. Since Covid, it has risen several percentage points, even without expanding Medicaid in large states like Texas and Florida.
% of Total US Population enrolled in Medicaid by Year
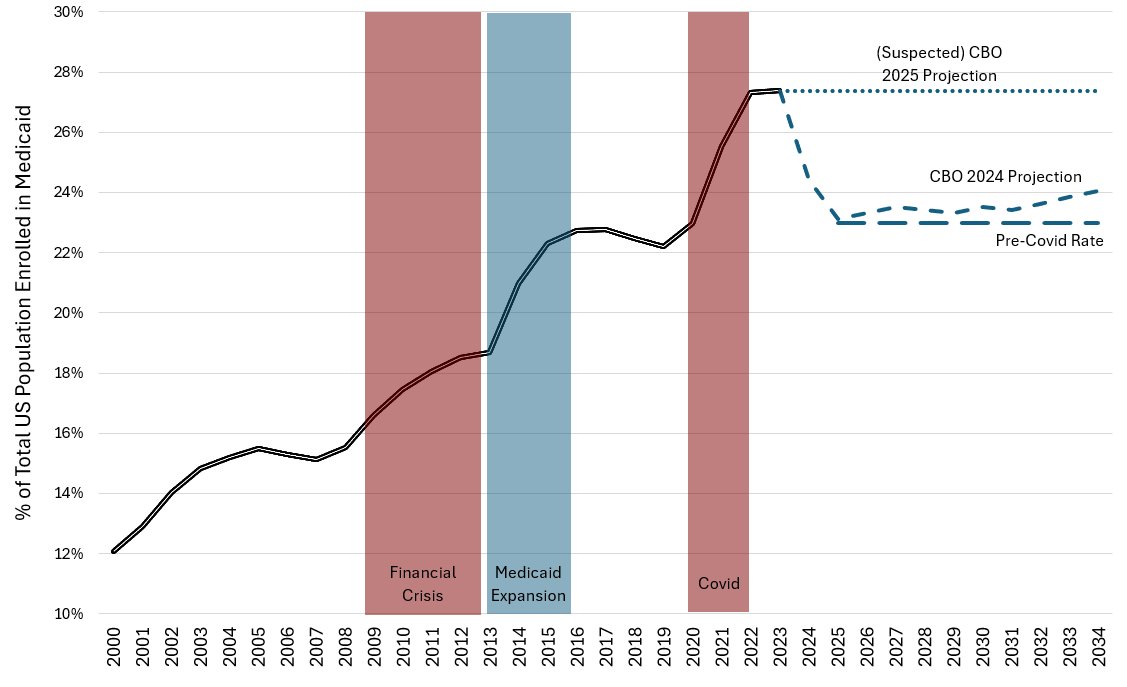
Source: Author Calculation based on NHE (Total Medicaid Enrollment), CBO (Projected Medicaid Enrollment). Note: The 2025 CBO projection for Medicaid spending is substantially higher than the 2024 CBO projection, but they have not yet released the breakdown. The dotted line represents a higher level of enrollment which could explain the higher CBO estimates.
Setting a maximum Medicaid enrollment of 23.0%, the highest level it reached before Covid and after the ACA expansion, would save $1.4 trillion over the next ten years.
Capping Medicaid enrollment at its pre-Covid peak would save $1.4 trillion over the next ten years.
Federal Medicaid Spending if Enrollment Held at Pre-Covid Maximum

Source: Author Calculation based on NHE (Total Medicaid Enrollment), CBO (Projected Medicaid Enrollment)
Conclusion
Rolling the Medicaid program back to the pre-Covid norm, when there were no significant criticisms of its inadequacy, would save more than Republicans are pushing for.
Medicaid has expanded in scope and scale over the past twenty-five years and has grown to a point where some pruning can be accomplished without the devastating results that many warn will occur. Simply rolling the program back to its scale from prior to the pandemic would provide more money than Congress is looking for and would return Medicaid to funding and enrollment levels that, at the time, drew little to no criticism.
Notes
For a counterargument, Kaiser Family Foundation claims it's impossible.
For some supportive analysis and a more detailed proposal for Medicaid, Manhattan Institute
Stray Thoughts
One of the explanations CBO gave for increased expected Medicaid spending from 2026-2035 was new spending on GLP-1s, which reduce obesity. Theoretically, though, the reduction in obesity should also lead to improved health and reduced spending. I'm curious if that is included in their estimates.
Footnotes
1This number has fallen in 2024 as the Medicaid expansions from the Covid-era are being unwound. The rate today is between 25 and 26%.
Saturday, May 13, 2023
Budget Cuts! - Some Context
Header image used without permission from Reason
Both Sides of the Spending Cuts Debate
The DC set is currently in its decennial debt-ceiling fracas. Since there's a Republican-controlled House and a Democratic president, it's time to argue over the debt. Republicans want to reduce spending and Democrats want the authority to spend every dollar that's been legislated.
The Republicans passed a bill that would reduce spending by $4.8 trillion over the next ten years, according to the CBO. The primary element of the plan would reduce discretionary spending, starting in 2024 to the same level as in 2022, and then grow it by 1% per year. (See here for other elements)
Democrats have criticized this plan for cutting spending.
House Republicans would rather take health care away from millions of Americans than have the wealthy and big corporations pay their fair share. pic.twitter.com/GJymOPcwYi
— The White House (@WhiteHouse) May 9, 2023
While President Biden’s budget upholds our nation’s sacred obligation to care for our veterans and invests in our seniors, MAGA House Republicans are pushing cuts that would threaten critical services. pic.twitter.com/JOWMUp8WtL
— The White House (@WhiteHouse) May 8, 2023
House bill cuts nondefense discretionary spending by 28% or 58% (depending on assumptions) in real per cap terms by 2033. NDD includes infant nutrition, border security, Pell, FBI, housing subsidies, etc.
— Catherine Rampell (@crampell) May 1, 2023
Which of those will get targeted? GOP can technically claim none of them!
The left-leaning Center for American Progress even did its own analysis of the budget cuts and called them "deep programmatic cuts", "slashing funding by nearly 60% within a decade". While I was unable to replicate their findings, I do like their approach of calculating spending per person. I also think some historical context is opportunistically elided.
Context
Since 2000, non-defense discretionary spending (basically the part of the budget that politicians have the most power over, which doesn't include Social Security or Medicare spending), has increased by 68% in real terms! Over the same period, the US population only increased by 18%, which means that, per person, discretionary spending has increased by 43%.
This is the same number CAP wants to focus on, real discretionary spending per person, and it's what is used in its analysis. Theoretically, a government that provides the same services over time should be spending approximately the same amount per person. Its spending has to grow to accommodate more people, and in fact, should probably fall per-person as larger organizations are generally more efficient.
But instead, the per person spending has increased by 48%, meaning the services provided, the staff providing them, or inefficiency have grown over that period. It's against this growth that Republicans want to begin to rein in spending which Democrats are calling draconian.
Per person, inflation-adjusted spending has increased by 48% since 2000, excluding Social Security, Medicare, Medicaid, and defense.
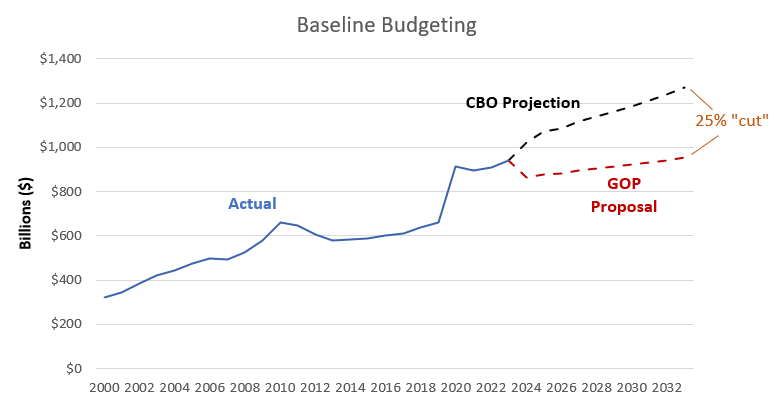
The below chart shows the CBO projection (black dashed line) against the historical context (solid blue line) and the GOP proposal (red dashed line). Spending increased gradually from 2000 to 2006, dipped slightly before jumping after the 2009 financial crisis. Then it fell again and held mostly steady until Covid and it set a new record high. It fell slightly, but was still significantly higher than the 2012-2019 norm.

From there, the CBO projects an increase followed by a slight decline while the GOP proposal would immediately cut it to still-above 2019 levels and keep cutting until it fell back to 2002 levels. It should be noted that even if this budget proposal gets passed into law, which it won't, the chances of this decline happening given future Congress's penchant for spending is nil, but it is important to understand how this proposed spending compares to recent years.
Fun with Cost Bases
Readers should always take budget cut projections with a grain of salt, because whereas most people think of budget cuts as 'how much lower will future spending be versus today', when dealing with the federal budget, journalists and Democrats report budget cuts as 'how much lower will future spending be versus projected future spending.' And because projected spending already includes increases, the budget cut figures are always inflated.
This is illustrated in the figure below.
There are other ways, too, to report the change in spending. You could compare to the most recent year, you could compare to before the pandemic started, or you could compare to either of those two, after correcting for inflation and accounting for population growth. The below chart shows what cuts would look like based on four different bases.
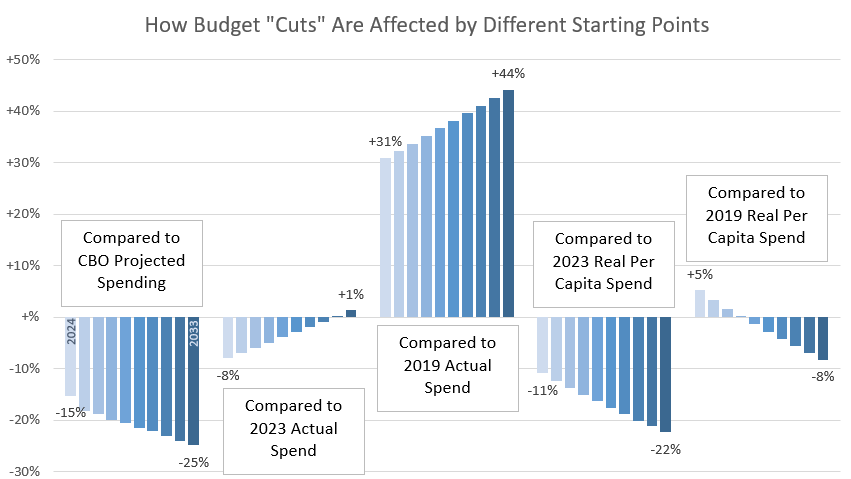
In my view, the best one to use is the last one, comparing the spending per capita, inflation-adjusted to 2019, the last pre-pandemic year. Unless you think there's a reason for size of government to have increased post-pandemic, the spending per person should be roughly the same as then. Another reason to use this as a benchmark is that this figure stayed roughly the same from 2003 through 2019 except for the financial crisis period.
Most people would agree that government might need to be larger during crisis periods, therefore smaller in non-crisis periods. After the financial crisis, the size of government shrunk back to its pre-crisis size, and there's a strong argument that it should do so again today, not maintain its pandemic levels.
After the financial crisis, the size of government shrunk back to its pre-crisis size, why shouldn't it follow the same pattern post-pandemic?