
While a majority of Americans support government funded scientific research, and many support foreign assistance, people often argue that foreign aid and government-funded research are miniscule parts of the federal budget so don't matter, but when you How much does the typical taxpayer contribute to foreign aid and NIH? The answer will probably surprise you. Lower than you might think.
Firstly, as of 2024, US government revenues were 17.1% of GDP, while expenditures were 23.4% of GDP. This means, in 2024, revenues made up only of government revenues only cover 72.9% of government expenditures, so we can say that only 72.9% is paid for by taxes, the rest is paid for by debt-purchasers.
Of all government revenues, income taxes make up about 49%. The next largest portion, 35%, comes from payroll taxes, but since payroll taxes are meant for Social Security and Medicare, they are not used for foreign aid or NIH. Because Social Security and Medicare make up a significant portion of US spending, and they're paid for, in part, by separate payroll taxes, these programs should probably not be included in these calculations.
As a result, individual taxpayers pay only 56% of the cost of NIH and foreign aid. However, even this doesn't tell the full story. Because the federal income tax is progressive, not everyone who pays federal income tax pays for the same share of government.
Proportion of Income Taxes Paid and Discretionary Spending by Income
| Annual Income Range | Proportion of Total Income Taxes Paid | Contribution to Discretionary Spending (%) |
|---|---|---|
| $0 - $25,000 | 0.4% | 0.2% |
| $25,000 - $50,000 | 3.5% | 1.9% |
| $50,000 - $75,000 | 5.4% | 3.0% |
| $75,000 - $100,000 | 5.8% | 3.2% |
| $100,000 - $200,000 | 19.5% | 10.9% |
| $200,000 - $500,000 | 22.2% | 12.4% |
| $500,000 - $1,000,000 | 11.5% | 6.5% |
| $1,000,000+ | 31.8% | 17.8% |
Note: Percentages are author's calculation based on Table 3.5 (2022 version) from IRS Statistics site - https://www.irs.gov/statistics/soi-tax-stats-individual-statistical-tables-by-tax-rate-and-income-percentile
Proportion of Discretionary Spending Paid by tax filers, based on income
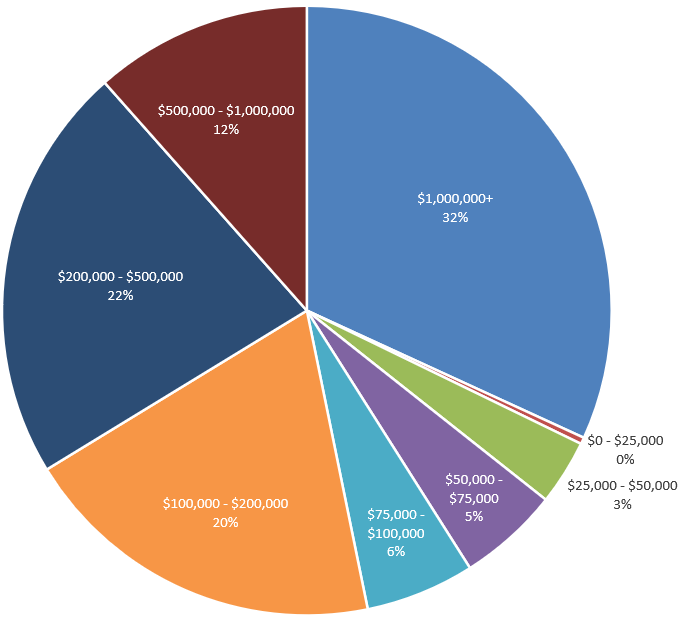
Author's calculation
Accounting for all of this, taxpayers contribute much less to NIH and foreign aid than they might first think. The table below lays out the per tax-filer income tax contribution to these programs based on income level.
Total Contribution to Various Discretionary Programs, based on income
| Income Range | Total Foreign Aid | USAID | NIH |
|---|---|---|---|
| $0 - $25,000 | $3.01 | $1.85 | $1.97 |
| $25,000 - $50,000 | $37.57 | $23.10 | $24.56 |
| $50,000 - $75,000 | $90.60 | $55.70 | $59.22 |
| $75,000 - $100,000 | $153.50 | $94.37 | $100.34 |
| $100,000 - $200,000 | $303.02 | $186.28 | $198.08 |
| $200,000 - $500,000 | $891.78 | $548.21 | $582.94 |
| $500,000 - $1,000,000 | $2,777.15 | $1,707.23 | $1,815.38 |
| $1,000,000+ | $15,938.36 | $9,797.99 | $10,418.68 |
Total program costs can be found at previous post on subject. https://chrisoldman784482.substack.com/p/making-up-for-doge