
This is my first post with graphics!
Liberals argue that when you include all taxes (Federal Income, Federal Payroll, Excise, State Income, Corporate, etc.), while the tax system is progressive, it's not extremely so. Ezra Klein has posted [Editor Note: Previous link to internet archive version; also available at WaPo.com] this chart to back him up.
Originally going to post about how I believed it inappropriate to include payroll taxes, I ended up wanting to see a breakdown by tax. I found this pretty informative article by the Peter G. Peterson foundation that includes many charts using data from the Tax Policy Center.
Here is a similar chart (with more categories) but without state taxes.
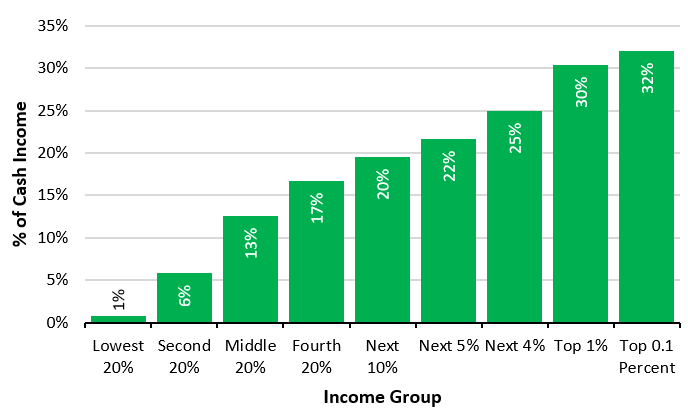
[Editor note: the original graphic is no longer available from the source. The image above is the author's attempt to re-created the graphic from the description and the raw data.]
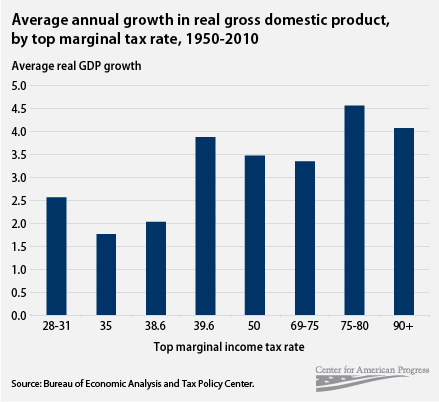
These graphics tell very different stories. People should be aware how analysts and pundits can use data to create any message they want. The major differences in these graphs are that Klein's graph seems to use statutory tax rates (payroll at ~12.4% for everyone, marginal federal tax rate, and marginal state rates), while the graph below it uses effective rates based on "cash income," which the Tax Policy Center defines.
In my view, neither of them is ideal, but the Peterson foundation is closer to correct. The payroll tax is meant to pay for transfers, and, as a result, is only one side of the equation. If someone wants to include the payroll tax in their comparison, they are obliged to also include the transfers themselves and treat the system more holistically.