Friday, October 11, 2024
Topic: Politics
Content Type: Analysis
Keywords:
, polls, Silver, model, election, RCP, ,
What's the Matter with Michigan?
Nate Silver and RCP Produce Different Averages. It's worth knowing why.
The majority of election-hawks seemed to have settled on election forecast models being the ideal approach to understanding elections and what polls are saying. These models undoubtedly have several characteristics that commend them--weighing polls based on several factors such as historical accuracy, introducing error to make the predictions more probabilistic (75% chance of winning for candidate X instead of predicting a winner outright), and using non-poll data to fill in some gaps from polling such as a convention bounce or undecideds.
What people should be wary of, though, is being overly confident in these models and attributing to them an objectivity or accuracy that doesn't exist. Partisanship has led to an over-confidence in these models. It's worth bearing in mind how the modelers' choices can affect the ultimate outcome and how accurate the models are, at the end of the day.
A good way to evaluate a model is by comparing to a simple average. RCP has fallen way out of favor for most election-hawks, particularly those who lean left, but it's much simpler and can be a good measuring stick even if it's not as data-driven. Also, it performed better in 2016 and 2020 than 538 did.
Why is Michigan so Different?
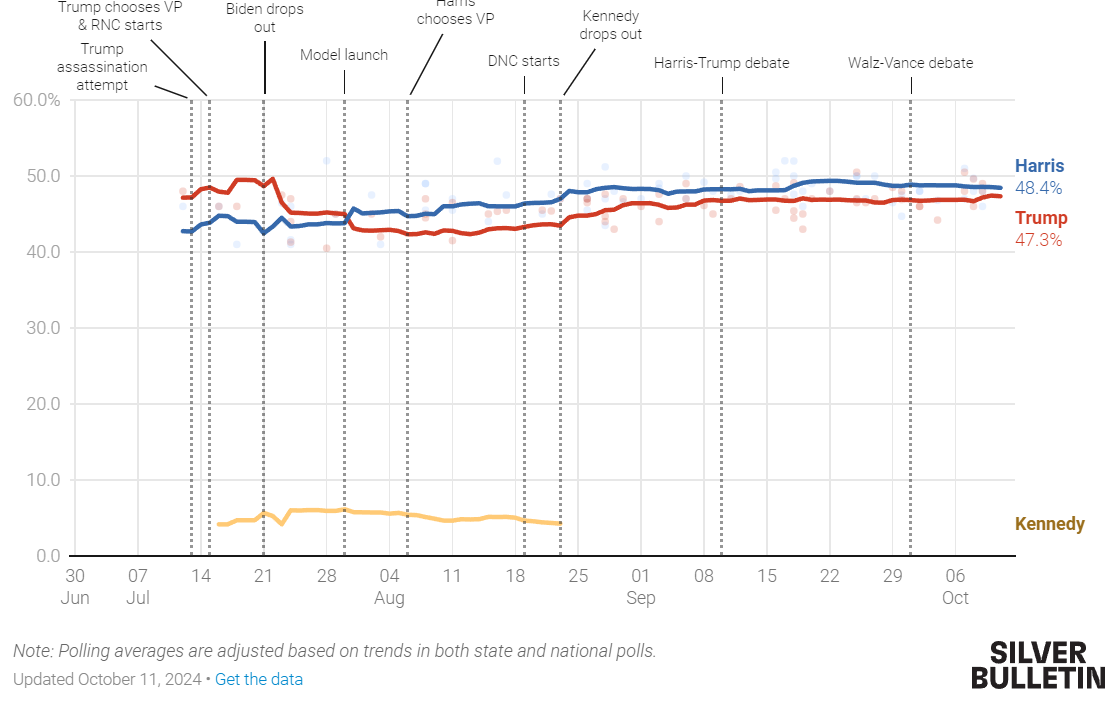
Right now, Nate Silver has Harris up by 1.1% (48.4 to 47.3). RCP, on the other hand, has Trump up 0.9 in Michigan (48.5 to 47.6). How can they be getting such different results? I presume most reading will reflexively think "Because RCP sucks" or the more diplomatic "Because RCP is run by conservatives who bias the results." Actually, that's not the case with Michigan.
Difference in Timing
The first difference is that RCP has a more recent cut-off. RCP considers only the 10 most recent, non-repeated polls. This effectively, for Michigan, goes back to 9/19, as of today, so 3.5 weeks. Silver's model considers polls going back to 8/30--6 weeks, double RCP. The effect of this is to add weight to older polls. If trends have moved since then, it will produce biased results. This has definitely been the case. Taking all of the polls in Silver's model, and estimating a 5 poll moving average shows movement toward Trump recently.
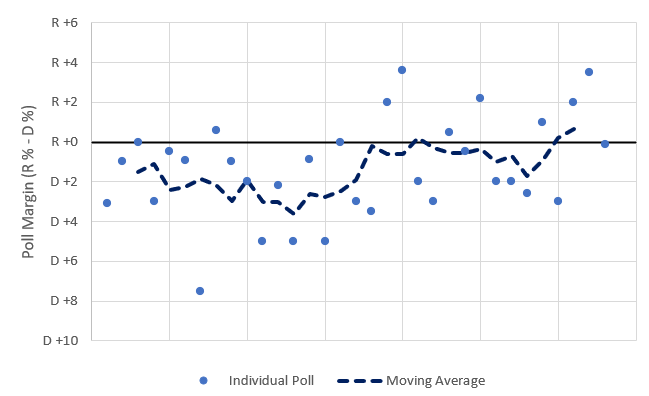
If Silver cut off the polls at the same time as RCP, it would move the polls about 0.2% toward Trump.
Differences in Poll Choice and Weighting
One of the smart decisions Silver made was to weight polls according to their historic accuracy along with other factors. Contrarily, RCP has a more subjective and simple weighting method. RCP's editors choose which polls to include, which usually are the most high profile ones. After that decision is made, all polls are weighted equally. On the other hand, Silver includes all polls and weights them using historic data, a measure of transparency, and sample size.
For the time period that RCP is using, it includes 10 polls, while Silver includes 16. Of the 10 that are in both 6 of them have Trump winning. Of the 16 Silver includes, Trump is winning in 7 of them. Meaning RCP is disproportionately leaving out polls which have Harris ahead. The ones in Silver's average are disproportionately less famous.
The table below shows which polls made it into the averages. It also shows Silver's letter grade for each pollster. For the most part, the cut-off for RCP corresponds to a letter grade of B-. The only exception is Mitchell Research (Trump +0.5), Morning Consult (Harris +3.5), and some combinations of polling firms.
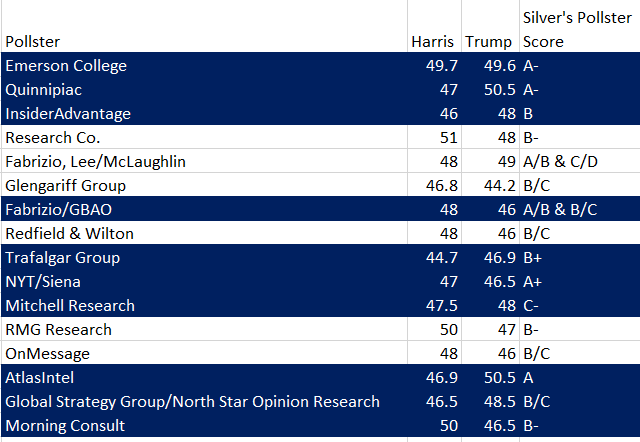
Blue denotes polls that were included both in Silver's average and RCP's average. Taken 10/11/2024.
If all firms were included in RCP's average, weighting them all equally, however, Trump would be up by 0.9 instead of 1.0, their poll choice doesn't have much effect on the outcome.
What Else?
Beyond these explanations, admittedly, I can't figure out what's driving the difference. I don't know exactly how Silver calculates his average, but I tried accounting for house effects and weights, and can't reproduce it. I don't have the ability to plug in the non-poll fundamental effects, so it's some combination of that and his secret sauce on polling calculations that I just can't crack.
Using the weights that he provides, before accounting for house effects etc., I calculate, from his data in Michigan, that Trump is winning by -0.2%. Then adding in the house effects, I still have him winning by -0.2. (It's not that they didn't change anything; they certainly did. It's just that they cancelled each other out.
At the moment, I cannot explain how Silver's result is so pro-Harris. It's hard to believe that the fundamentals give her a 1.2% bump, but that's the only thing I can think of.